PROVIDENT FINANCIAL HOLDINGS (PROV)·Q2 2026 Earnings Summary
Provident Financial Holdings Q2 FY2026: Profit Up 65% YoY Despite Sequential Decline
January 27, 2026 · by Fintool AI Agent
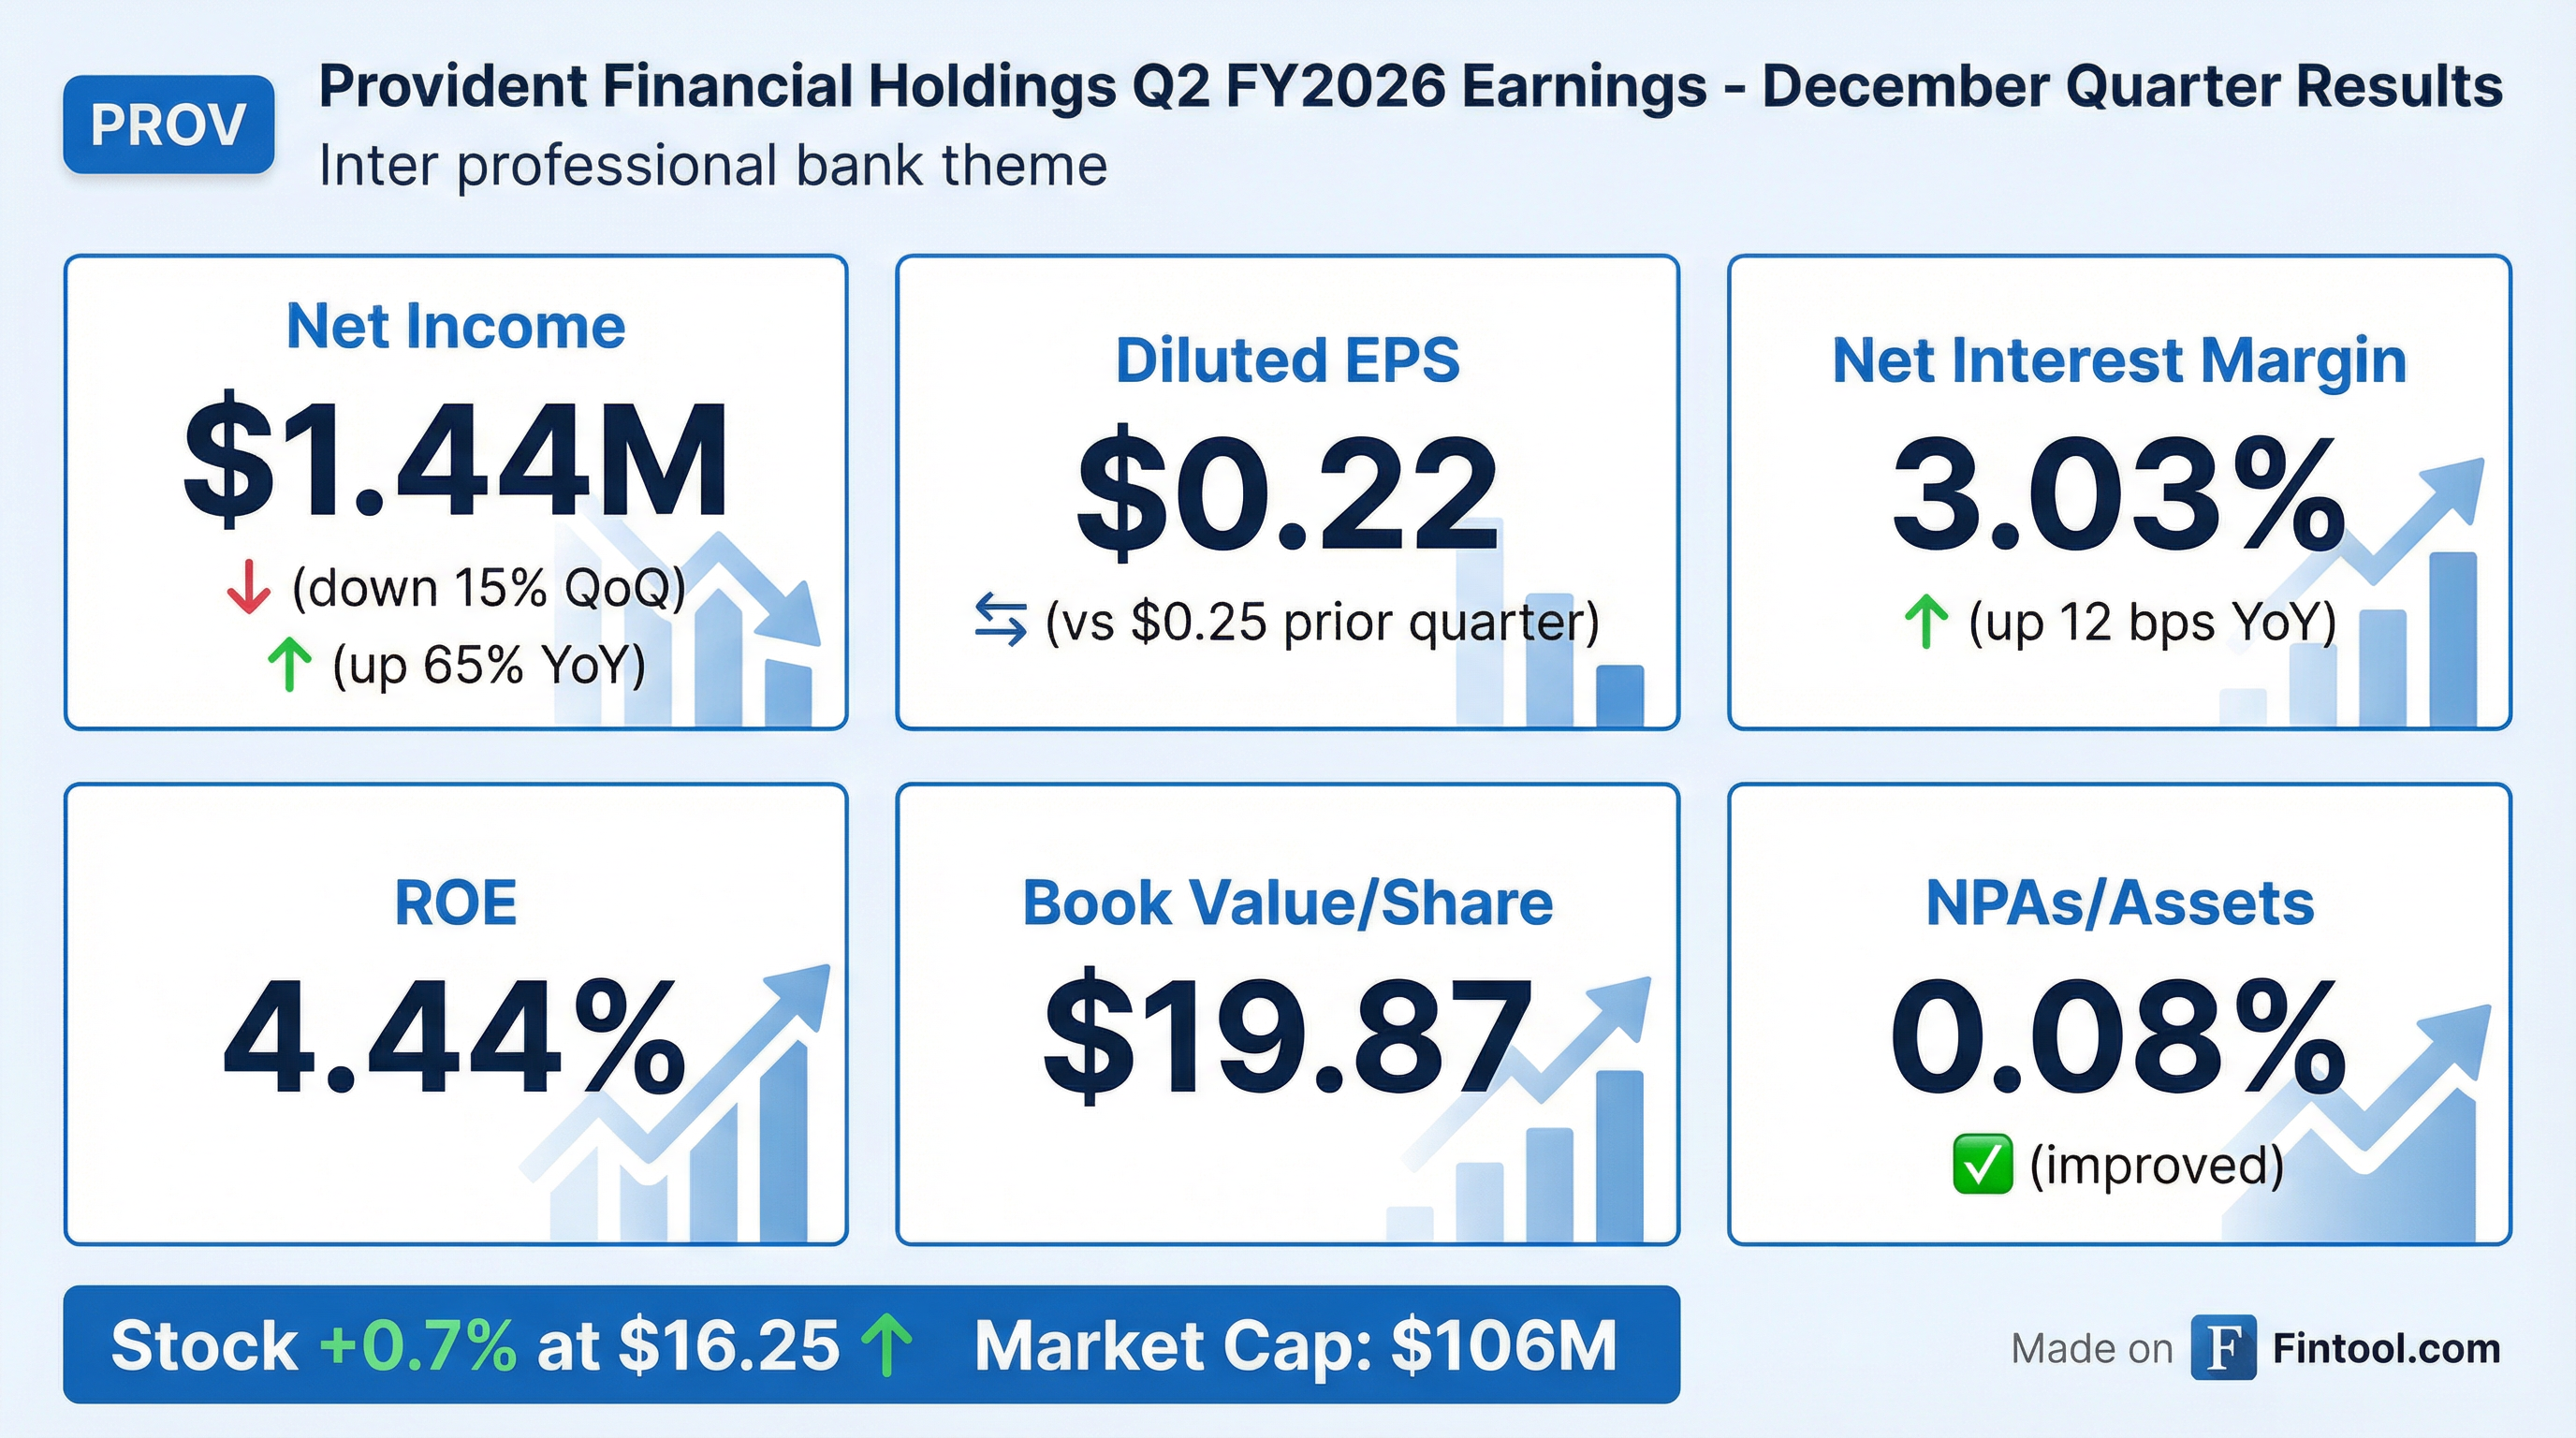
Provident Financial Holdings (NASDAQ: PROV), the holding company for Provident Savings Bank, reported Q2 fiscal 2026 results showing net income of $1.44 million, or $0.22 per diluted share, for the quarter ended December 31, 2025 . While earnings declined 15% from the prior sequential quarter, the result represents a 65% improvement from the year-ago period when the bank earned just $872,000 .
The Inland Empire-focused thrift delivered solid credit metrics and margin expansion despite a competitive lending environment. CEO Donavon Ternes struck an optimistic tone, stating the bank is "encouraged by a stable economic environment" and believes "a normalizing yield curve positions us well for future performance" .
Did Provident Financial Beat Earnings?
With limited sell-side analyst coverage, a precise beat/miss comparison is difficult. However, the quarterly performance can be evaluated against historical trends:
The sequential decline was driven by two factors: a $468,000 lower recovery of credit losses compared to Q1 and a $315,000 increase in non-interest expense that included a non-recurring $214,000 pre-litigation settlement expense .
How Did the Stock React?
PROV shares traded up 0.7% to $16.25 on the day of the earnings release . The muted reaction suggests the market viewed results as largely in-line with expectations given the bank's consistent execution.
The stock has performed well over the past year, trading near its 52-week high of $16.36. Key valuation metrics:
What's Driving Net Interest Margin?
The 12 basis point year-over-year improvement in NIM to 3.03% reflects disciplined asset-liability management :
Yield on earning assets rose 7 bps to 4.73%, driven by:
- Adjustable-rate loans (~$112M) repriced upward 23 bps from 6.74% to 6.97%
- Investment securities yield improved 7 bps to 1.59%
Funding costs declined 5 bps to 1.87%, as:
- FHLB borrowing costs fell 14 bps to 4.39%
- Average borrowings declined $36.7M (16%) to $190M
However, deposit costs increased 9 bps to 1.32% due to CD competition . Brokered CDs totaled $129.2M at a weighted-average cost of 4.01% .
What Changed From Last Quarter?
The Q1-to-Q2 sequential comparison reveals several notable shifts:
Pre-Provision Earnings Rose: Pre-provision, pre-tax income actually increased to $2.1M from $1.9M sequentially , demonstrating underlying earnings power improved. The net income decline was driven entirely by lower credit loss recoveries and the one-time legal settlement.
Credit Loss Recovery Normalized: The bank recorded a $158,000 recovery of credit losses in Q2 versus a $626,000 recovery in Q1 . Both quarters benefited from declining mortgage rates shortening the estimated life of the loan portfolio .
One-Time Expense Hit: A $214,000 pre-litigation voluntary mediation settlement related to an employment matter pressured non-interest expense .
Non-Interest Income Improved: Total non-interest income rose $104,000 (13%) sequentially to $917,000, driven by higher unrealized gains on equity investments and no loan sale losses .
Loan Originations Accelerated: Portfolio loan originations totaled $42M in Q2, up 42% sequentially from $30M in Q1 . This pickup in lending activity may signal improved loan growth ahead after several quarters of flat balances.
Efficiency Ratio Weakened Slightly: The efficiency ratio ticked up to 80.77% from 78.35% in Q1, though it improved from 81.15% a year ago .
How Is Credit Quality?
Credit metrics remain pristine for this California thrift:
Non-performing assets consist of four single-family loans and one multi-family loan, all secured by California properties . The bank recorded zero net charge-offs during both the current and year-ago quarters .
Notably, there were no loans in the early stages of delinquency at December 31, 2025, indicating an absence of emerging credit issues .
CRE Office Exposure: The bank has $36.7M or 3.5% of loans secured by office buildings, with just 6 CRE loans totaling $2.8M maturing in the remainder of fiscal 2026 . Management expressed confidence that based on underwriting characteristics of borrowers and collateral, these loans will continue to perform well .
Conservative Underwriting Metrics (as of Dec 31, 2025) :
The low LTV ratios and strong borrower credit scores provide significant loss protection.
What Is the Balance Sheet Position?
Provident maintains a conservative balance sheet focused on residential and commercial real estate lending:
Loan Mix (as of Dec 31, 2025) :
- Single-family (1-4 units): $553M (54%)
- Multi-family (5+ units): $408M (39%)
- Commercial real estate: $71M (7%)
Liquidity Position: The bank has $456.4M of total borrowing capacity across FHLB ($213M), FRB San Francisco ($193M), and correspondent bank lines ($50M) .
Capital Ratios (Bank level) :
- Tier 1 Leverage: 9.79%
- CET1 Ratio: 18.67%
- Total Risk-Based Capital: 19.56%
Capital Return and Shareholder Value
Provident continues returning capital through both dividends and buybacks:
Dividends: Maintained quarterly cash dividend of $0.14 per share, distributing $906,000 to shareholders in Q2 .
Share Repurchases: Bought back ~$96,000 of common stock in Q2 (approximately $1.5 million in H1 FY26 combined) . With 54,061 shares remaining under the current authorization , the buyback runway is limited.
Payout Ratio: Capital management activities represented 170% of Q2 net income — a clear signal that management views the stock as undervalued and is committed to returning excess capital .
Book Value: Grew to $19.87 per share from $19.54 at September 30, 2025 and $19.18 a year ago .
At a current price of $16.25, the stock trades at 0.82x tangible book value — a meaningful discount for a bank with excellent credit quality and consistent profitability.
Management Commentary
CEO Donavon Ternes emphasized discipline in a challenging environment:
"Even in a highly competitive environment for loans and deposits, we continued to execute with discipline, maintaining strong underwriting standards and prudent pricing. Credit quality remains excellent, our net interest margin expanded, and operating expenses were well controlled."
On the outlook, Ternes expressed cautious optimism:
"Looking ahead, we are encouraged by a stable economic environment and believe that a normalizing yield curve positions us well for future performance."
Key Risks and Considerations
The 8-K highlighted several risk factors worth monitoring :
- Interest rate sensitivity: Changes in rates could affect NIM and asset values
- Competitive pressures: Repricing and deposit competition in Southern California
- Geographic concentration: Loan portfolio concentrated in Riverside and San Bernardino counties
- Real estate exposure: Heavy reliance on California residential and commercial property
- Deposit stability: Core transaction deposits declined 3% from June to December 2025
Forward Catalysts
Positive drivers to watch:
- Further NIM expansion in March 2026 quarter as wholesale funding reprices lower
- June 2026 loan repricing: $125M repricing 38 bps higher to 6.49%
- Credit loss reserve releases if zero-delinquency track record continues
- Continued aggressive capital return (170% payout ratio)
Potential headwinds:
- March 2026 loan repricing: $112M repricing 14 bps lower
- Elevated prepayment activity offsetting strong origination momentum
- Accelerated deferred loan cost recognition from payoffs impacting NIM
- Limited buyback authorization remaining
Q&A Highlights
During the earnings call, analyst Timothy Coffey from Janney probed management on several key topics:
On loan portfolio growth outlook, CEO Ternes acknowledged the uncertainty around payoffs:
"We've been focusing on increasing our origination volume each and every quarter. We've been able to do so essentially for the last five quarters or so... But it's very difficult to discern what loan payoffs look like, which will ultimately then drive what the loan balances look like at the end of the quarter."
On June repricing as a headwind, Ternes downplayed concerns:
"When we think about where those loans are repricing, and we compare to current market conditions with respect to new loan production, it looks like they're a bit higher than new loan production, but they're not substantially higher from where new loan production is coming in."
He also noted the double-edged sword of elevated payoffs — they hurt both loan growth and NIM through accelerated deferred loan cost recognition. In Q2, payoffs negatively impacted NIM by 5 basis points versus no impact in Q1 .
On federal housing affordability initiatives, Ternes highlighted California's structural supply deficit:
"In the state of California, available housing is far outstripped by demand, and so anything that is done by local, state, or federal governments that would expand available housing, lowering new construction costs and the like, would be helpful, and that would ultimately drive more buyers."
NIM Expansion Outlook
Management provided specific detail on the path to further margin expansion:
Near-term repricing dynamics:
- March 2026: ~$112.2M of adjustable loans repricing 14 bps lower to 6.85% from 6.99%
- June 2026: ~$125.2M repricing 38 bps higher to 6.49% from 6.11%
Funding cost tailwinds:
- March 2026: ~$109M of wholesale funding (FHLB, brokered/government CDs) maturing at 4.12% weighted average
- June 2026: ~$79.5M maturing at 4.15% weighted average
New loan production at 6.15% is meaningfully higher than the portfolio's 5.22% weighted average rate . Management stated: "All of this currently suggests that there continues to be an opportunity for net interest margin expansion in the March 2026 quarter" .
Operating Expense Guidance
Management guided to a quarterly operating expense run rate of $7.6M-$7.7M for the remainder of fiscal 2026, excluding the non-recurring $214K legal settlement that hit Q2 . FTE headcount was essentially flat at 163 versus 162 a year ago .
Loan Portfolio Dynamics
The transcript revealed that elevated payoffs are offsetting strong origination momentum:
Loan pipelines are "moderately higher than last quarter," suggesting March 2026 originations in the $28M-$42M range . Lower mortgage rates are driving both stronger origination activity and higher prepayment activity .
Company: Provident Financial Holdings, Inc. (Research Page)
Document: Q2 FY2026 Earnings Call Transcript
Prior Quarter: Q1 FY2026 Earnings